From Results to Action
The value of an audit is realized through the program changes that follow it. This section describes how findings become ranked interventions, how targets are set at a defensible level, and how the re-audit cycle — methodology held constant — establishes whether the changes worked. It is the section the next audit is designed against.
Three levers
Every intervention an audit can motivate pulls one of three levers, and naming the lever keeps recommendations concrete. Reduce generation: less material enters any stream (purchasing changes, food-waste prevention, reuse). Improve capture: material that is generated reaches its correct stream (infrastructure, convenience, signage, service coverage) — this is the lever the §09 current-versus-potential gap measures. Reduce contamination: what reaches a diversion stream belongs there (education targeted at the specific contaminants found, feedback, container design). A recommendation that cannot name its lever, its finding, and its approximate tonnage is not yet a recommendation.
The intervention matrix
| Audit finding | Lever | Documented responses | Evidence base |
|---|---|---|---|
| High divertible organics in garbage | Capture | Organics collection where absent; bin co-location and pairing where present; kitchen and custodial workflow changes; caddies at generation points | Strong for infrastructure measures; education alone shows small, decaying effects |
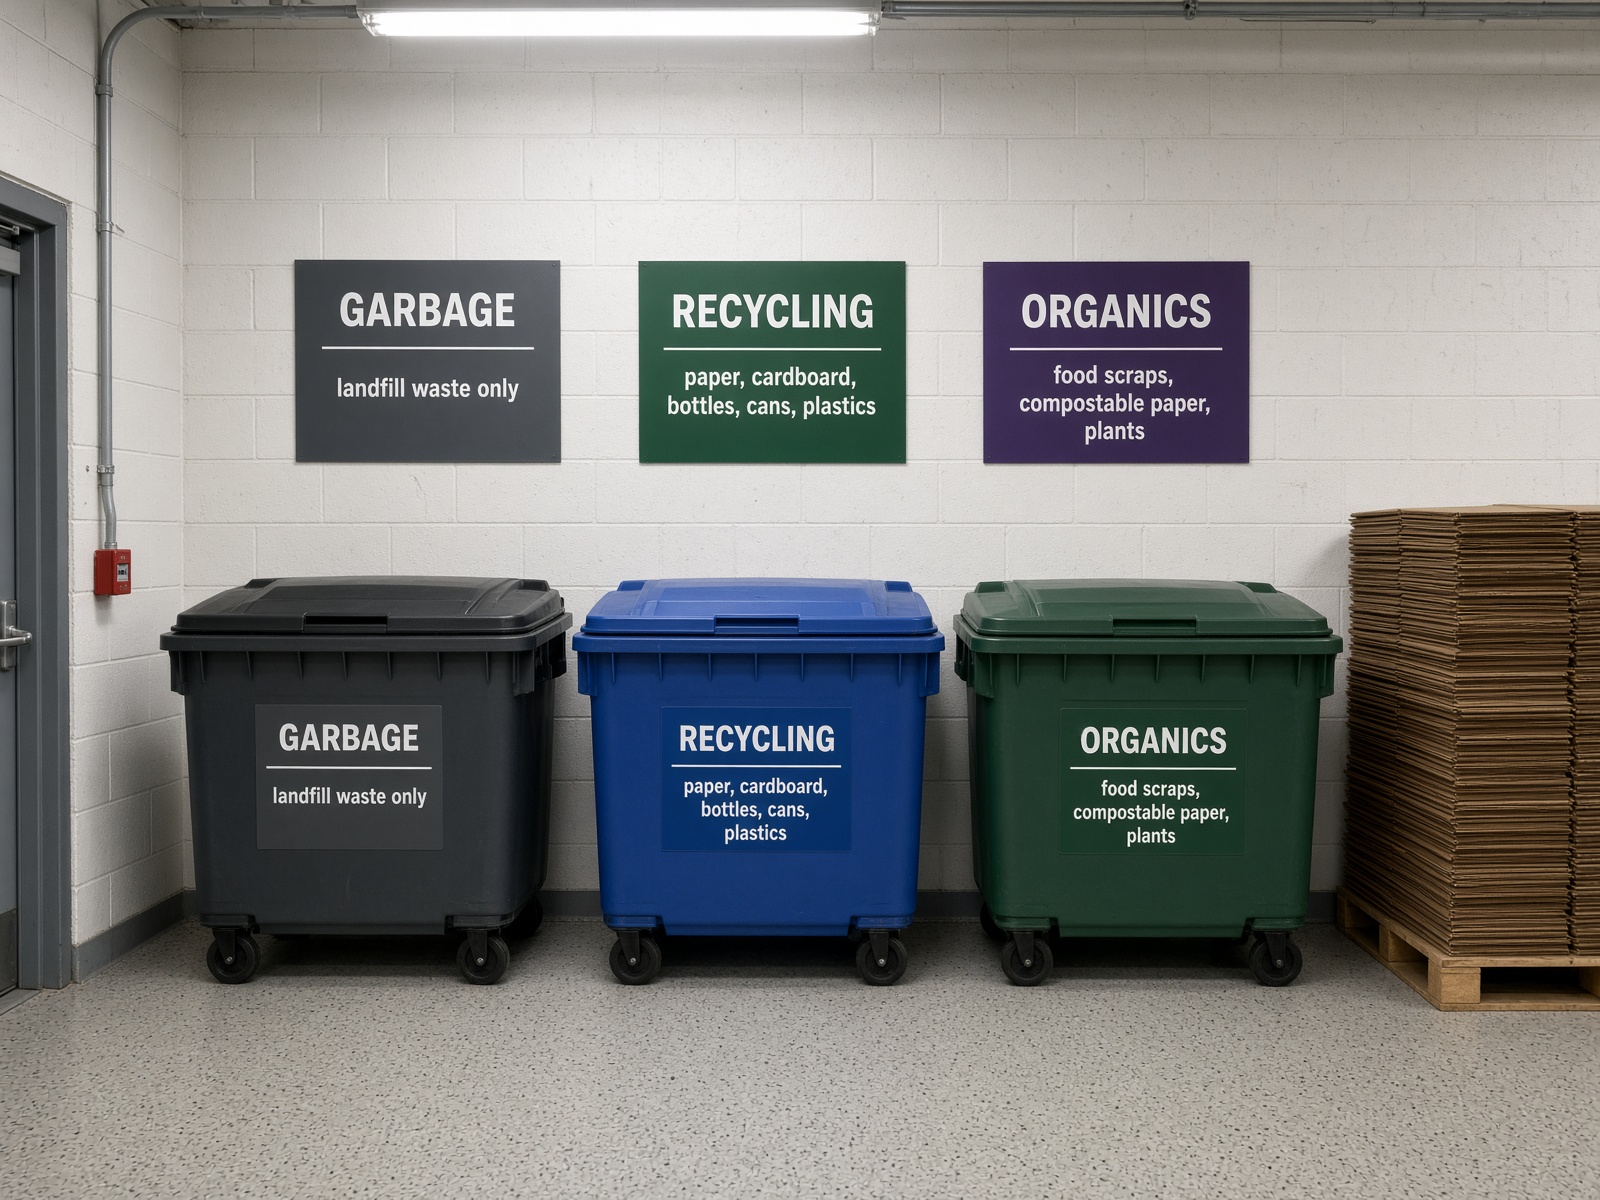
| High recyclables in garbage | Capture | Pair every garbage bin with recycling; standardize container appearance across the site; close "garbage-only" gaps (washrooms, entrances) | Convenience and pairing effects are among the best-replicated findings in the field |
| High contamination in recycling | Contamination | Point-of-disposal signage naming the audit's actual top contaminants, with photographs; remove ambiguous container openings; hauler feedback loop | Specific-contaminant signage outperforms generic "recycle right" messaging |
| High contamination in organics | Contamination | Certified-liner policy communicated at the bin; film-plastic messaging; clear anchor images of accepted materials | Film plastics dominate organics contamination in most programs — target them by name |
| High avoidable food waste | Generation | Portion and procurement review in food service; date-label education; donation pathways for surplus | The avoidable/unavoidable tier-3 split (§06) is what makes this finding actionable |
| Low set-out / participation (curbside) | Capture | Route-targeted promotion; container policy review (size, provision); service-frequency evaluation | Set-out counts from §02 identify where, not just how much |
| Underutilized container capacity | — | Service-level renegotiation with monitored fill data; right-sizing before rescheduling | Direct cost recovery; §01 cost-iceberg component made visible by F-01's container inventory |
| One department or route dominates a finding | Any | Localized intervention at the hotspot rather than site-wide programming | Available only where the design kept departments or routes separate (§02) |
Prioritizing: impact against effort
Recommendations are ranked on two axes: the tonnage they address (from the §09 potential-diversion gap, apportioned by finding) and the effort they demand (cost, approvals, behaviour change required). The quadrant framing is coarse by design — its purpose is sequencing, not precision.
Setting targets
The §09 potential-diversion figure is a ceiling, not a target: it assumes perfect capture of every divertible kilogram, which no program achieves. Defensible targets are set as movements along the capture scale — for the Maple Centre example, organics capture of 28% might reasonably target 55–60% within two years of an infrastructure-led intervention, with the target stated alongside the baseline, the measure, and the re-audit date that will test it. Two disciplines keep targets honest: they are set per stream (a single diversion-rate target hides which program moved), and they are ratcheted from evidence — the second re-audit sets the third target, not aspiration.
Documenting the change
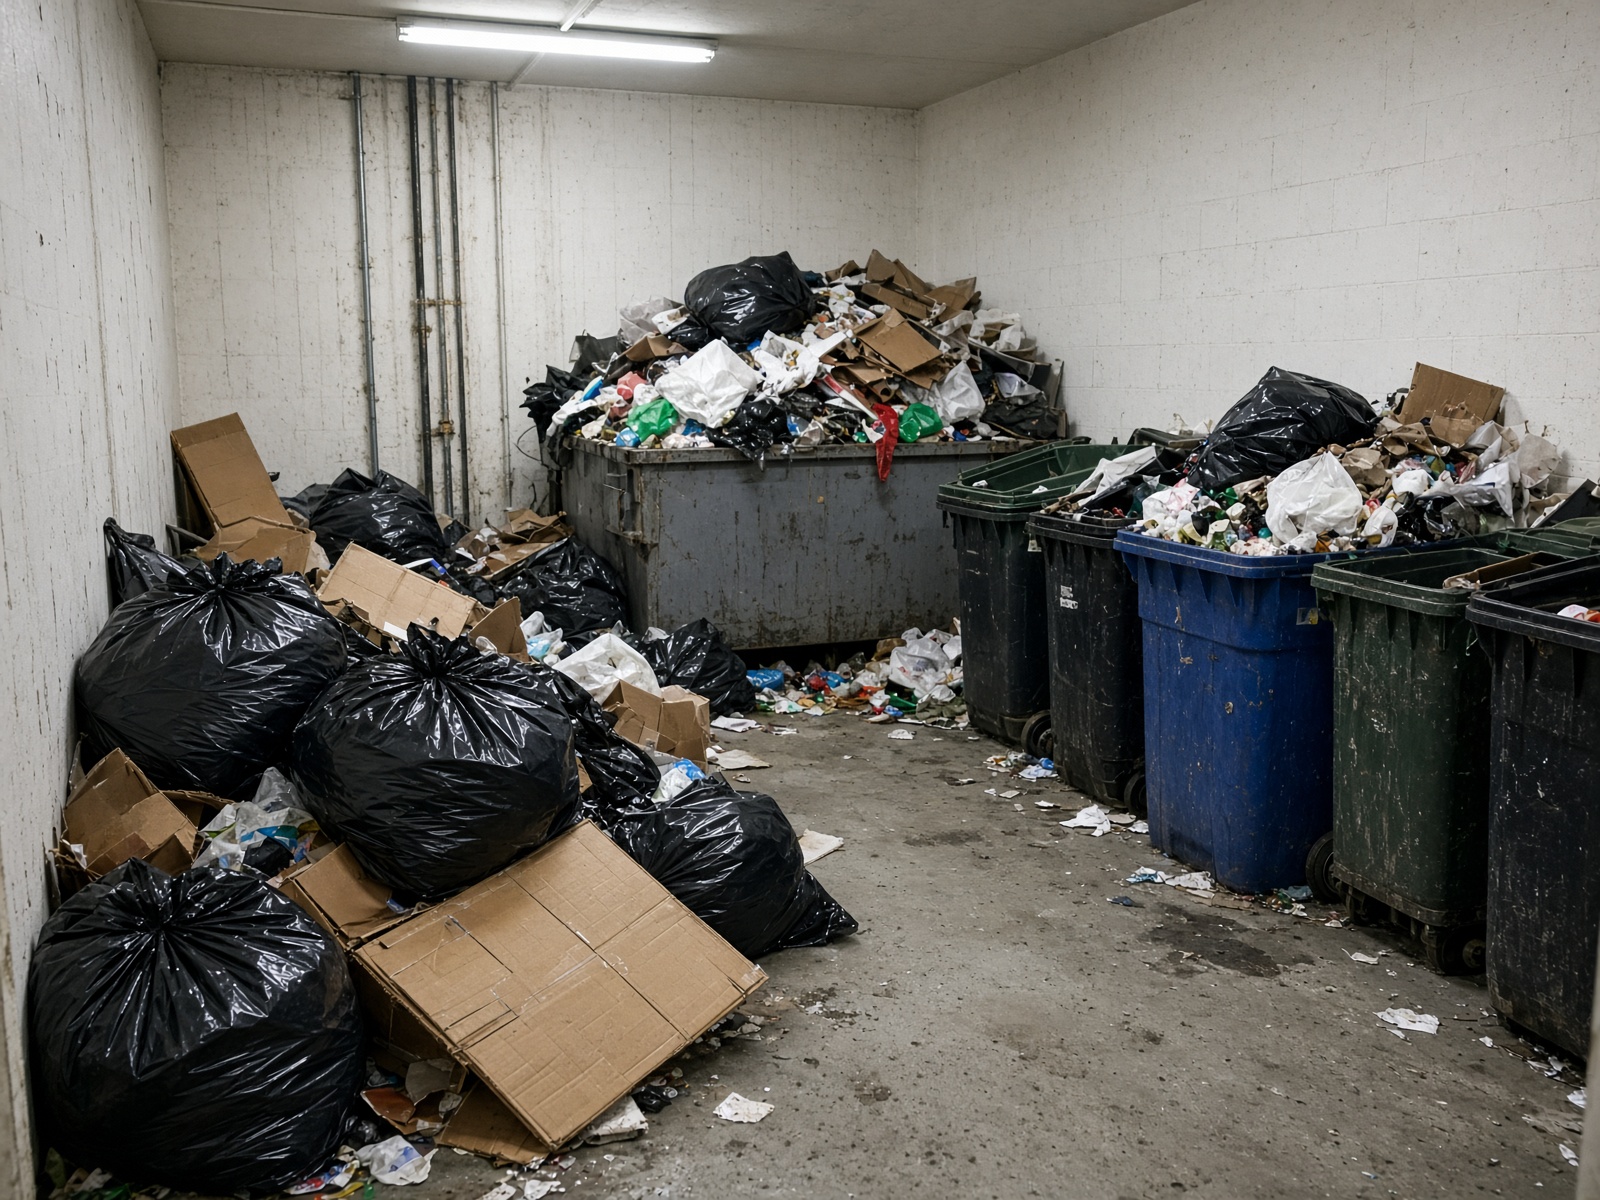
Interventions are documented with the same care as the audit itself, because the re-audit comparison is only as interpretable as the record of what changed between passes: what was implemented, where, when, and at what cost — plus photographs. The F-01 container inventory and its photos from the baseline audit serve as the "before" record; the same inventory is repeated when the intervention lands.
The re-audit cycle
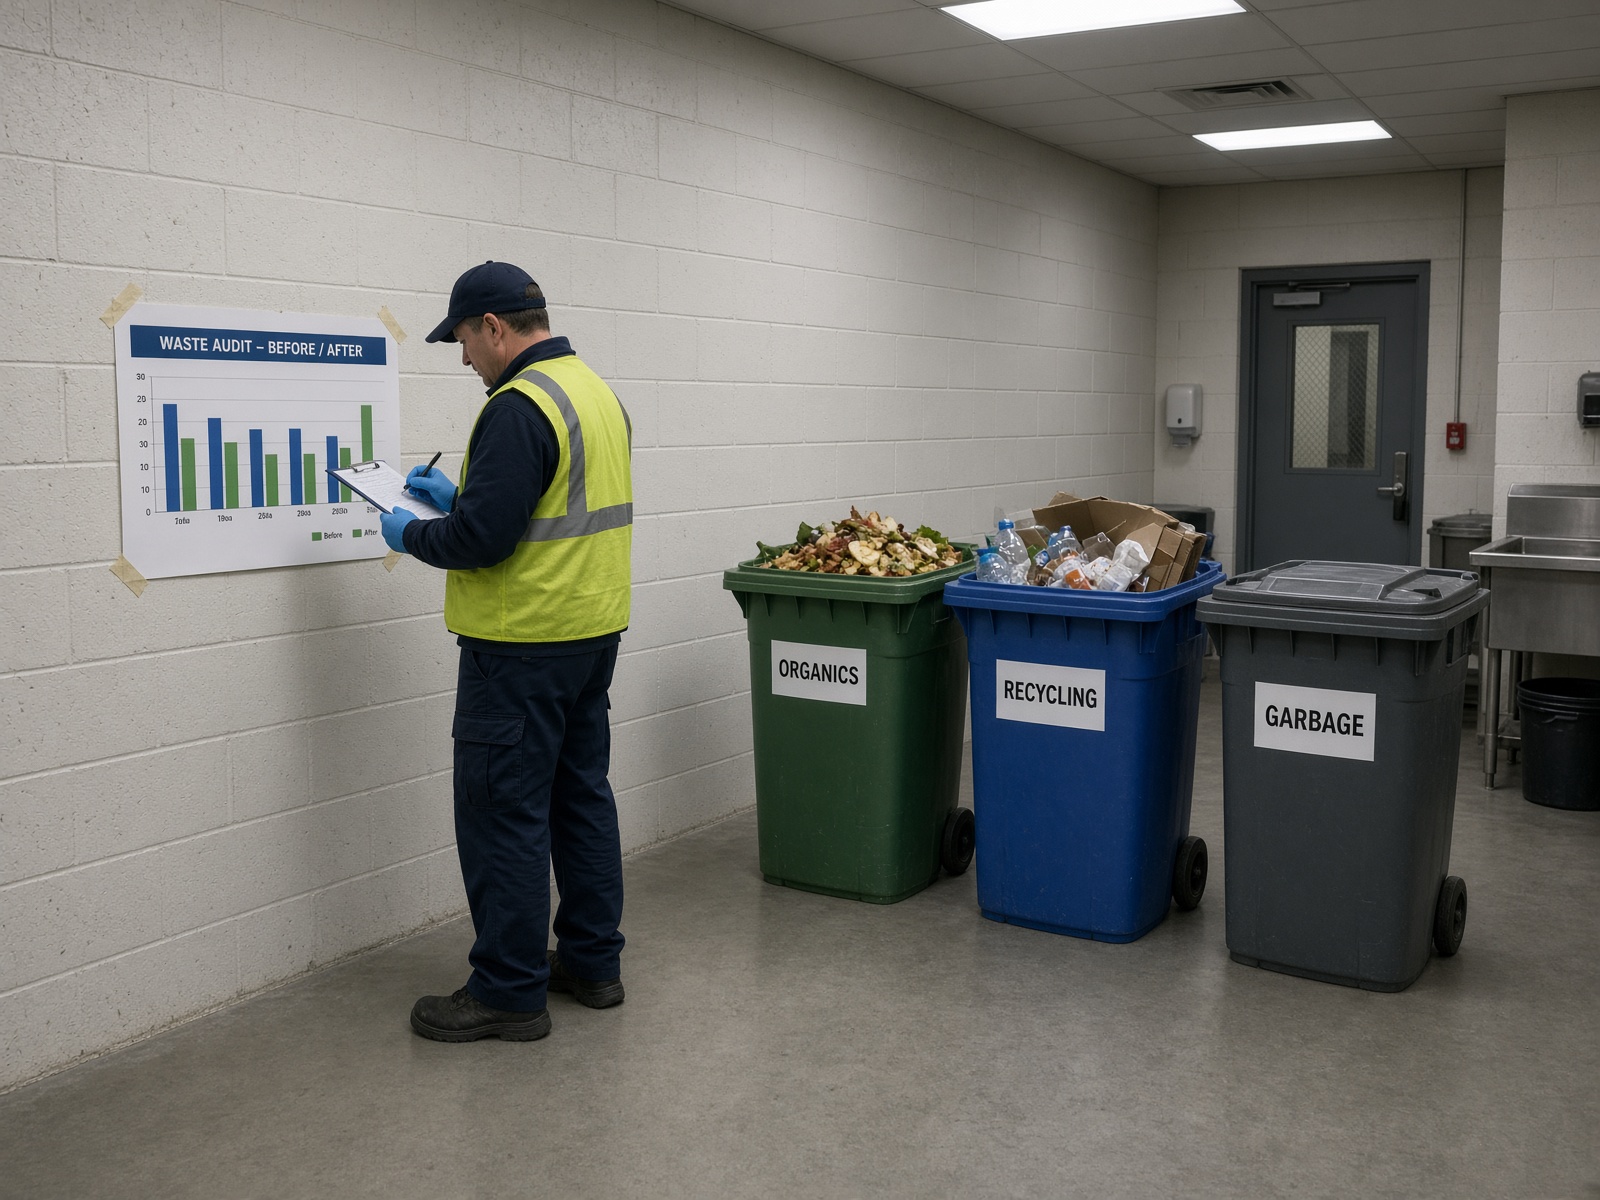
The re-audit is scheduled when the intervention is approved, not after it settles — a date on a calendar is what separates evaluation from good intentions. Working guidance: twelve to twenty-four months for a routine cycle, or six to twelve months after a major program change (long enough for behaviour to stabilize past the novelty period, short enough that the comparison still informs decisions). The re-audit repeats the baseline's design brief (F-00) exactly — frame, samples, season, category list version — and reports the comparison under the §10 rules, including "no detectable change" where the difference sits inside the study's precision. Where budgets permit only small audits, a consistent annual indicative sort (§03) tracks direction between full studies.
Institutionalizing the cycle
Programs that sustain improvement embed the audit rather than re-deciding it annually. Four mechanisms recur: a recurring budget line for measurement, sized from §05's kit-and-crew figures; audit and data-access clauses in collection and processing contracts, so scalehouse tonnages and composition sampling rights exist when needed; a named owner for each recommendation, with the recommendation table from §10's report serving as the tracking document; and, where O. Reg. 102/94 applies, alignment of the cycle with the regulation's annual update duty (§01), so compliance and improvement run on one calendar rather than two.
Case Study · Maple Centre organics
Baseline: food waste ~41% of garbage, organics capture 28%. The site added labeled organics totes at the kitchen and dock, briefed kitchen staff, and recut the hauler pickup. The re-audit, 14 months later, using the same F-00 design brief, measured organics in garbage at ~12% and capture near 60%. Bin cost recovered in avoided tip fees within the first year.
illustrative — numbers from the worked example in §09Related
Tonnage attribution for ranking: §09's potential-diversion gap. Target-setting language and comparison rules: §10. Method constancy across passes: §02's design brief discipline. Small-audit trend tracking: §03's consistency principle.
Sources & further reading
- Ontario Ministry of the Environment — A Guide to Waste Audits and Waste Reduction Work Plans (waste reduction work plans: the regulatory form of the findings-to-action cycle)
- Ontario — O. Reg. 102/94 (annual review and update duty)